 United States Steel Corporation Building Value for Today and the Future April 4, 2007 Exhibit 99.1 |
| United States Steel Corporation Building Value for Today and the Future April 4, 2007 Exhibit 99.1 |
 2 Forward-Looking Statements This presentation contains forward-looking statements with respect to market conditions, operating costs, shipments, prices and profit-based compensation payments. Some factors, among others, that could affect 2007 market conditions, costs, shipments and prices for both domestic operations and USSE include global product demand, prices and mix; global and company steel production levels; raw materials' availability and prices; plant operating performance; the timing and completion of facility projects; natural gas prices and usage and availability; changes in environmental, tax and other laws; the resumption of operation of steel facilities sold under the bankruptcy laws; employee strikes; power outages; and U.S. and global economic performance and political developments. Domestic steel shipments and prices could be affected by import levels and actions taken by the U.S. Government and its agencies. Political factors in Europe that may affect USSE’s results include, but are not limited to, taxation, nationalization, inflation, currency fluctuations, increased regulation, export quotas, tariffs, and other protectionist measures. The level of income from operations is the primary factor affecting payments under the USWA profit-based plans. In accordance with “safe harbor” provisions of the Private Securities Litigation Reform Act of 1995, cautionary statements identifying important factors, but not necessarily all factors, that could cause actual results to differ materially from those set forth in the forward-looking statements have been included in the Form 10-K of U. S. Steel for the year ended December 31, 2006, and in subsequent filings for U. S. Steel. |
 3 United States Steel Corporation • 6 th largest global producer • 2 nd largest North American flat-rolled producer • 2 nd largest Central European flat-rolled producer • Largest North American seamless pipe producer • Domestic raw material balance • 2006 ROCE* – 29% Conservative, responsible company that generates a competitive return on capital and meets our financial and stakeholder obligations * ROCE = IFO/average(PPE + AR + Inventory – AP) |
 4 Flat-rolled segment • LTM 4Q’06 shipments – 14.2 million tons • Approximately 50/50 contract versus spot • Typical contract term 1-3 years • Contract industries include: auto, appliance, tin and electrical • Demands sophisticated metallurgical applications with specialized customer service and technical support • Contract business lessens impact of spot price fluctuations • Some spot deals based on CRU index Leading producer of high quality product |
 5 European segment • LTM 4Q’06 shipments – 6.3 million tons • Approximately 70% spot versus 30% contracts • Key industries: construction, service center, packaging and conversion • Commissioning auto quality galvanize line – 350,000 tonnes • Restarted second blast furnace in Serbia 6/2005 Includes both Slovakia and Serbia |
 6 Tubular segment • LTM 4Q’06 shipments – 1.2 million tons: Seamless 1.1 million ERW 118,000 tons • Primarily spot sales • Oil Country 75% - Standard & Line 25% • Size ranges (outside diameter): Seamless -1.9” to 24” ERW – 8” to 20” • Shipments: NAFTA 85% International 15% Oil country and standard and line pipe |
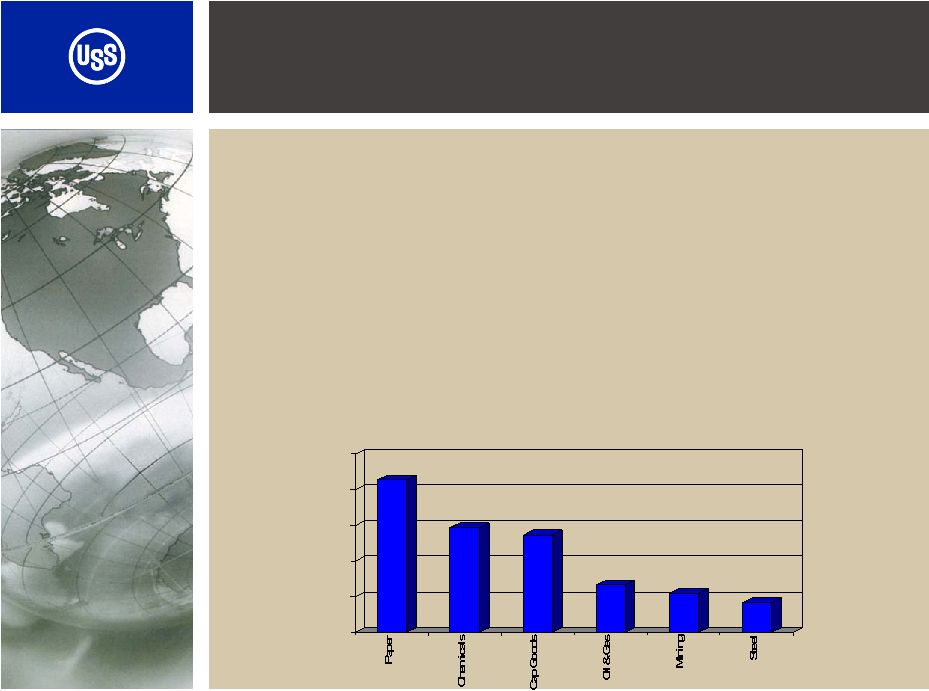 7 Improving Industry – Why invest in Steel? 18.8x 14.8x 14.2x 10.0x 9.3x 8.5x 6.0x 9.0x 12.0x 15.0x 18.0x 21.0x • Steel is a good product • Major regions are increasing consumption rates • Governments mostly out of industry (ex China) • Metallics are tight, level cost curve • Low Valuation: 2007 P/E* * Source: Deutsche Bank |
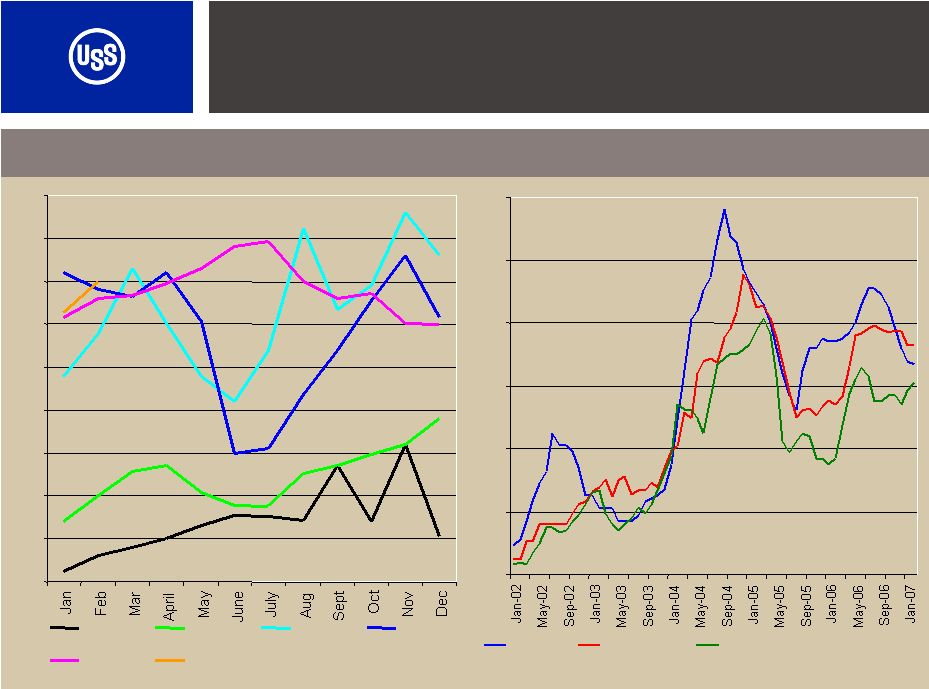 8 Strong business climate Source: Purchasing Magazine, CRU and SBB. Source: D.J. Joseph Company Selected Price Trends – Through February 2007 Shredded scrap composite $/Gross ton Hot rolled $/Net Ton $75 $100 $125 $150 $175 $200 $225 $250 $275 $300 2002 2003 2004 2005 2006 2007 $175 $275 $375 $475 $575 $675 $775 USA HR German HR East Asian HR |
 9 Global Raw Materials Integration Control over key raw materials 0 20 40 60 80 100 Coal '07 Coal '08 Iron Ore Coke Percent controlled Represents contracts Strong global raw material position: • Significant portion of coal requirement are under long-term contract thru ’08 •Second largest NA iron ore producer produced 22 mmnt in 2006 reserves 786 mmnt • Iron ore/coal mines and coke production facilities located in close proximity to steel operations with good infrastructure and competitive transportation costs • Produced 7.5 mmnt of coke in 2006 • Exploring additional raw material integration opportunities |
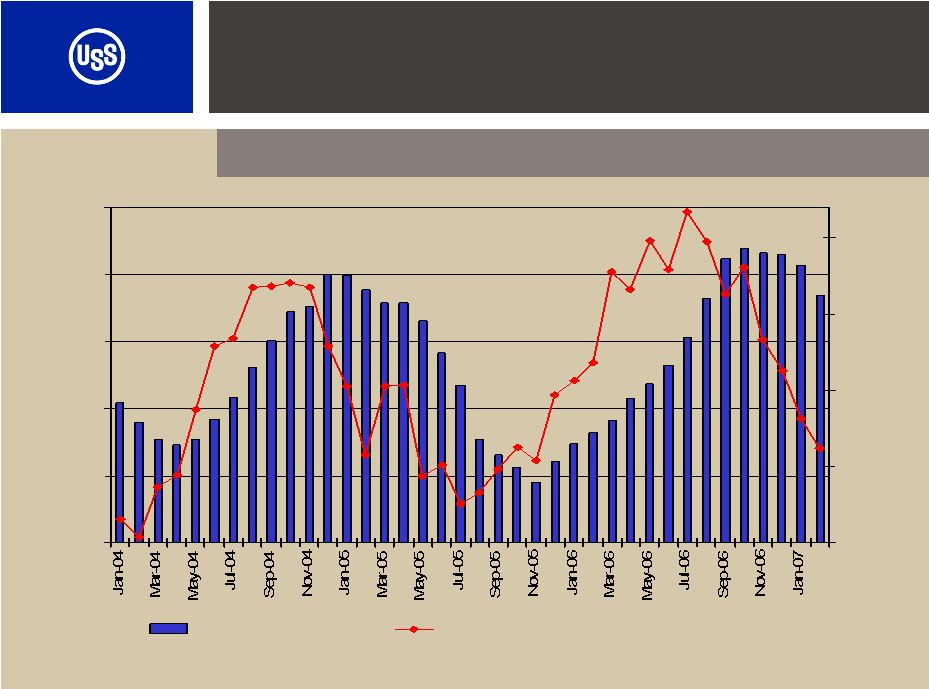 10 MSCI Flat Rolled Inventory Source: MSCI, U.S. Dept of Customs and Purchasing Magazine January 2004 – February 2007 6,000 7,000 8,000 9,000 10,000 11,000 400 650 900 1,150 1,400 Tons (thousands) Sheet Imports (thousands) $350 $756 $513 $660 $580 $600 $635 $535 $460 |
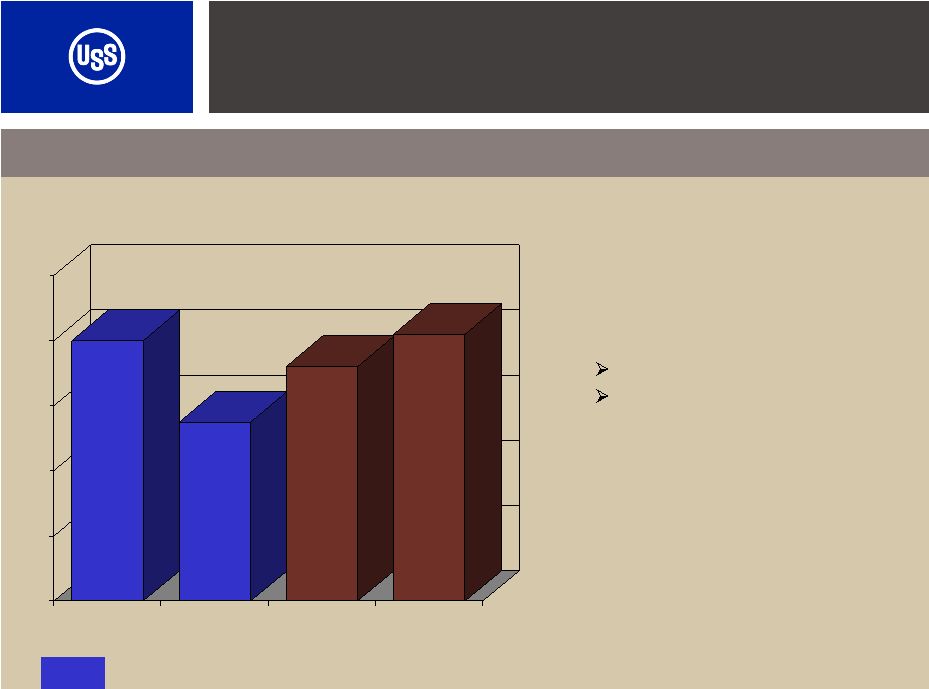
 11 $0 $75 $150 $225 $300 $375 $450 Raw Materials Energy Labor Raw Material Cost - Impact on hot rolled band costs Source: J.P. Morgan and company estimate Raw material cost inflation has leveled the playing field – HRB cash cost $/ton China & other low-labor cost steel Producing countries US flat-rolled mini-mill steel producers U.S. integrated steel producers 66% 71% 15% 19% 18% 12% 17% 68% 24% 24% 52% 41% 51% 8% 15% 23% 12% 65% $190 $362 $204 $340 $270 $369 |
 12 • Improve capital structure and strengthen balance sheet • Focused capital plan • Responsible capital allocation • Remain shareholder focused Designed to improve shareholder value Responsible company that generates a competitive return on capital and meets our financial and stakeholder obligations Capital Allocation – Building Value |
 13 Improving capital structure – Building Value LTM 12/31/06 Since 1/1/03 As of ($ in millions) Cash Provided by Operations Capital Spending Debt Reduction Voluntary Pension & OPEB Funding Dividends Paid Stock Repurchases* Millions of shares repurchased $4,884 $2,284 $908 $695 $212 $700 13.1 * Repurchase program initially authorized 7/05 $1,689 $612 $587 $190 $78 $442 7.2 Balanced approach to capital allocation
|
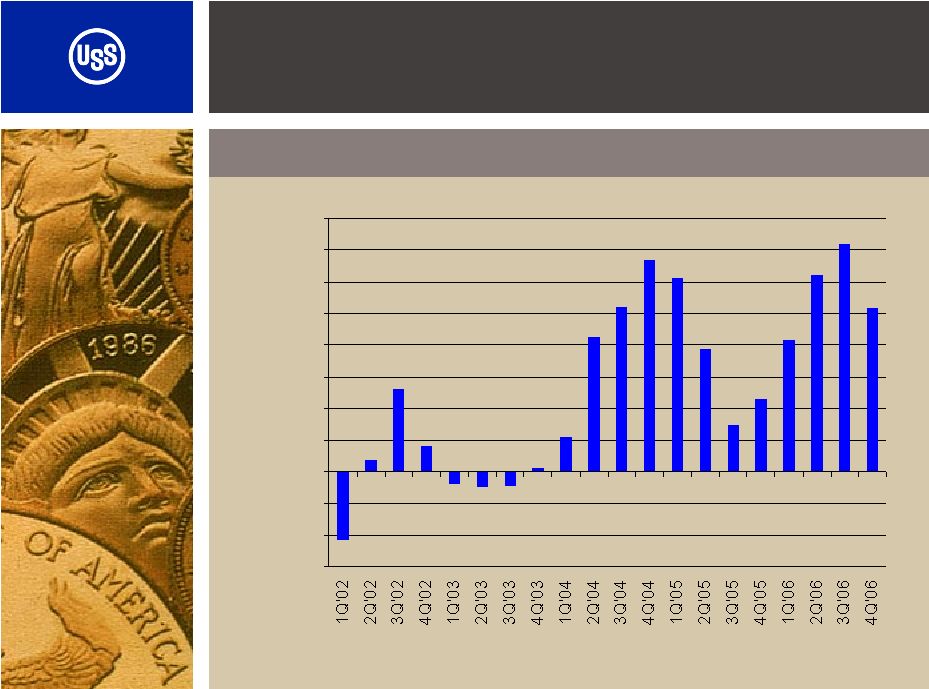 14 Improving Earnings Trend Adjusted earnings per share ($1.50) ($1.00) ($0.50) $0.00 $0.50 $1.00 $1.50 $2.00 $2.50 $3.00 $3.50 $4.00 |
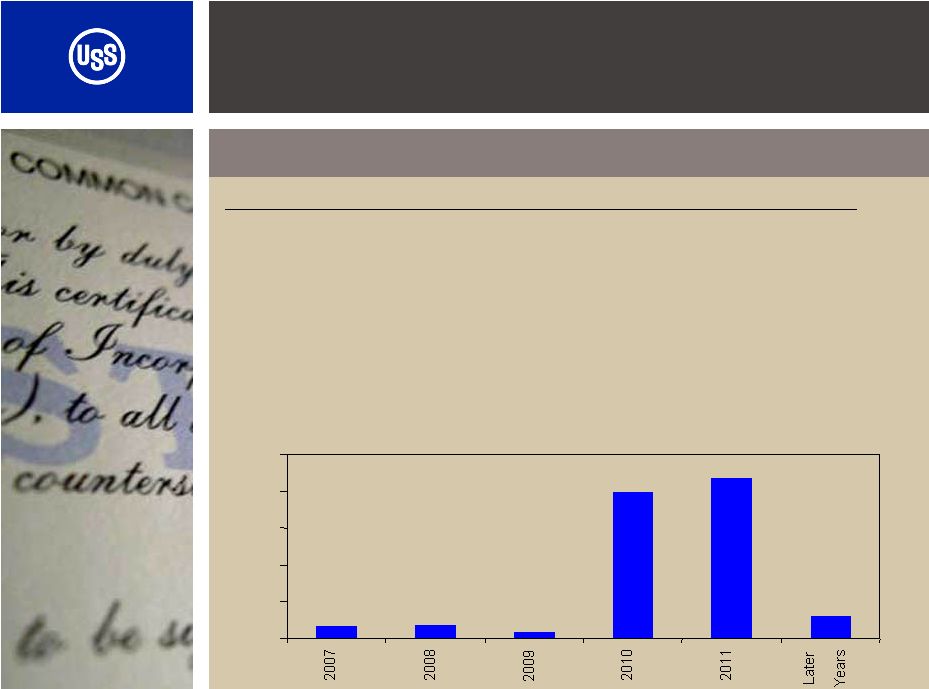 15 Improving capital structure – Building Value 12/31/06 12/31/03 As of ($ in millions) Cash Net working capital Total debt Employee benefits Total liabilities Stockholder equity Total Capitalization $316 $821 $1,933 $2,328 $6,742 $1,093 $7,837 Debt maturity schedule $1,422 $823 $908 $2,174 $6,183 $4,365 $10,586 * Excludes Squids * $61 $16 $434 $35 $33 $397 $0 $100 $200 $300 $400 $500 |
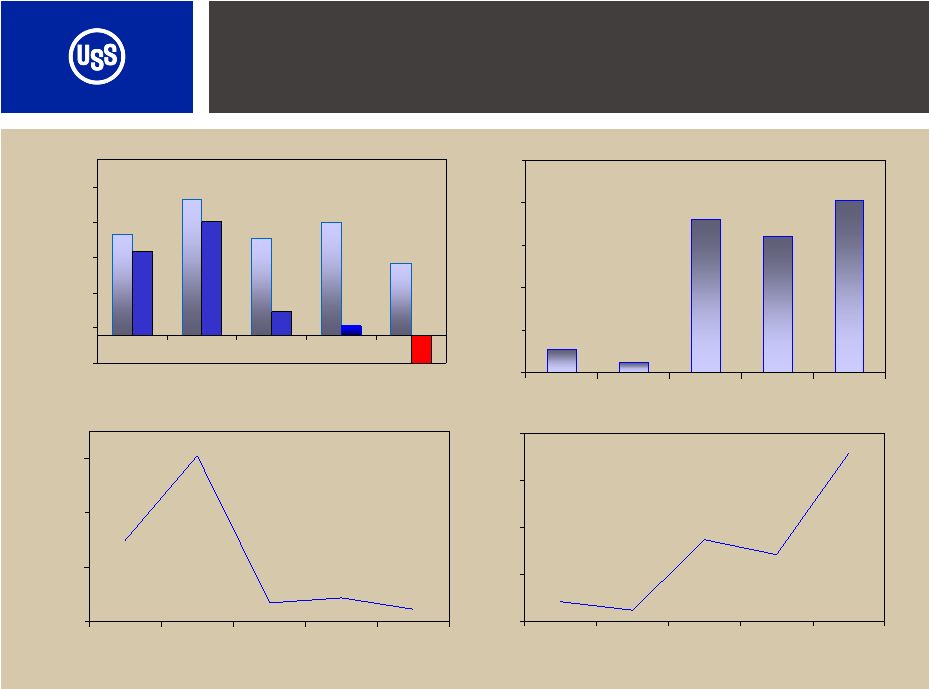 16 Improving Capital Structure – Building Value EBITDA/Net Interest EBITDA Total and Net Debt Total Debt/EBITDA Source: Company filings $1,434 $1,933 $1,371 $1,612 $1,025 ($400) $100 $600 $1,100 $1,600 $2,100 2002 2003 2004 2005 2006 3.0X 6.1X 0.7X 0.9X 0.5X 0.0X 2.0X 4.0X 6.0X 2002 2003 2004 2005 2006 $478 $316 $2,007 $1,805 $2,226 $200 $700 $1,200 $1,700 $2,200 $2,700 2002 2003* 2004 2005 2006 4.2X 2.4X 17.5X 14.2X 35.9X 0.0X 10.0X 20.0X 30.0X 40.0X 2002 2003* 2004 2005 2006 *Excludes $683 million of restructuring charges |
 17 Improving capital structure – Building Value Manageable legacy obligations – 2007 ($2,207) $660 $2,867 OPEB $212 $7,516 $7,306 Pension ($1,995) Funded status $8,176 $10,173 Total Plan assets Benefit obligation As of 12/31/06 ($ in millions) Total OPEB Pension 2007 Forecast ($ in millions) $290 $124 $38 $113 $328 $237 Cash Flow* Net Periodic Expense * Excludes any voluntary contributions Total OPEB Pension Key assumptions - 2007 5.5% 8.0% 5.5% 8.0% 5.5% 8.0% Discount rate Expected return on assets Key considerations Pension: • Defined benefit plan closed in 2003 OPEB: • Co-pays • Inflation cap • Voluntary pension & VEBA contributions totaling $695 million since 1/1/04 • Additional $300 million funding authorization |
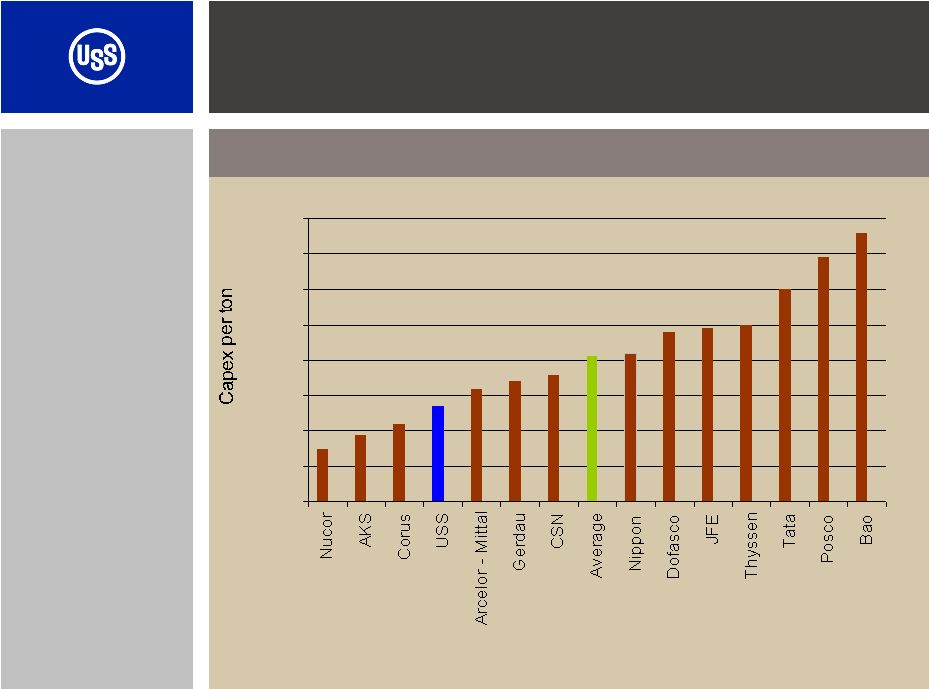 18 Capital Spending – Building Value 2003 – 2005 Average CapEx per ton shipped Source: Accenture $15 $27 $41 $76 $0 $10 $20 $30 $40 $50 $60 $70 $80 U.S. Steel has spent less than global peers in recent years Will likely incur higher capex during next few years concentrated on infrastructure, but will likely remain below the global average. |
 19 • Common dividend $0.80/share/year: Quadrupled since 01/05 • 7.6 million shares remaining under current repurchase authorization: Repurchased 7.2mm shares in 2006 Repurchased 13.1mm shares since 7/05 Shareholder focus – Building Value |
 20 Flat Rolled Products Segment Q4 2006 Review and Outlook $230 $62 $589 $651 3,695 3Q06 $11 $13 $586 $597 3,346 4Q05 = $10 Margin (loss)/ton = $638 Ave. Cost/ton $31 $648 3,078 4Q06 = Ave. Price/ton + Inc(loss) from Oper. (millions) + Shipments Outlook 1Q07 (tons in ‘000) Negatives Positives • End market demand remains fairly strong • Improving inventory and imports • Higher service center inventory levels |
 21 Tubular Products Segment Q4 2006 Review and Outlook $164 $541 $950 $1,491 303 3Q06 - $531 $510 Margin (loss)/ton = $992 $946 Ave. Cost/ton $144 $1,523 271 4Q06 $149 $1,456 292 4Q05 - Ave. Price/ton - Inc(loss) from Oper. (millions) - Shipments Outlook 1Q07 (tons in ‘000) • Higher distributor inventory levels • Lower shipments & prices • Near record rig counts • Strong demand Negatives Positives |
 22 U. S. Steel Europe Segment Q4 2006 Review and Outlook $219 $141 $499 $640 1,552 3Q06 Inc(loss) from Oper. (millions) Margin (loss)/ton Ave. Cost/ton Ave. Price/ton Shipments (tons in ‘000) - $117 $82 = $548 $498 $182 $665 1,549 4Q06 $112 $580 1,359 4Q05 - +/- + Outlook 1Q07 • Higher imports • Strong central European economy • Higher shipments • Stable costs Negatives Positives |
 23 • Strong business climate • Global raw materials integration • Building value: Improving capital structure Improving infrastructure and product mix Responsible capital allocation Remain shareholder focused Making Steel - World Competitive - Building Value Investment considerations |
 Strategic Acquisition of Lone Star Technologies, Inc. © United States Steel Corporation 2007 |
 Forward — Looking Statements 25 Risks and Uncertainties Regarding United States Steel Corporation and Lone Star
Technologies, Inc. Some factors, among others, that could affect market conditions, costs, shipments and prices for the domestic and foreign operations of U. S. Steel and Lone Star include global product demand, prices and mix; global and company steel production levels; global and domestic demand for tubular products; global and domestic energy markets; plant operating performance, including, the start up of several blast furnaces; the timing and completion of facility projects; natural gas prices, usage and supply disruptions; raw materials availability and prices; changes in environmental, tax and other laws; employee strikes; power outages; and U.S. and global economic performance and political developments. Domestic steel shipments and prices could be affected by import levels and actions taken by the U.S. Government. Economic conditions and political facts in Europe that may affect U. S. Steel’s foreign operations results include, but are not limited to, taxation, environmental permitting, nationalization, inflation, currency fluctuations, increased regulation, export quotas, tariffs, and other protectionist measures. Factors that may affect the amount of net periodic benefit costs include, among others, changes to laws affecting benefits, pension fund investment performance, liability changes and interest rates. Please refer to the Form 10-K of U.S. Steel for the year ended December 31, 2006 and the Form 10-K of Lone Star Technologies, Inc. for the year ended December 31, 2006 for additional factors that could cause actual results to differ materially from any forward-looking statements. Risks and Uncertainties Regarding the Transaction Forward-looking statements regarding United States Steel Corporation’s acquisition and integration of Lone Star Technologies, Inc. include statements relating to or concerning expected synergies, cost savings, accretive effect, industry size, and market sector. Risks and uncertainties regarding the transaction include the possibility that the expected synergies may not be realized in the time period anticipated or at all, that the market fails to perform as anticipated, and that the closing does not occur, either due to the failure of closing conditions, including the approval of the shareholders of Lone Star, or the failure to obtain required regulatory approvals, or other reasons. Even if the transaction closes as anticipated, integration may not proceed as expected, and the impact of changes in the industry, markets or the economy in general may result in unexpected costs or the failure to realize anticipated benefits of the transaction. Forward-looking statements included in this news release are made only as of the date hereof, and the companies undertake no obligation to update these forward-looking statements to reflect future events or circumstances except as may be required by law. |
 26 U. S. Steel acquires Lone Star for $2.1 billion or $67.50 per share All cash transaction •Financed with cash on hand and committed credit facilities Potential annual synergies in excess of $100 million by end of 2008 Acquisition expected to be accretive in 2007 before synergies •Excluding accounting effects of the sale of acquired inventory and other
customary purchase accounting adjustments Closing expected in second or third quarter 2007 U. S. Steel to Acquire Lone Star Technologies Transaction Overview Lone Star a leading North American producer of welded tubular products |
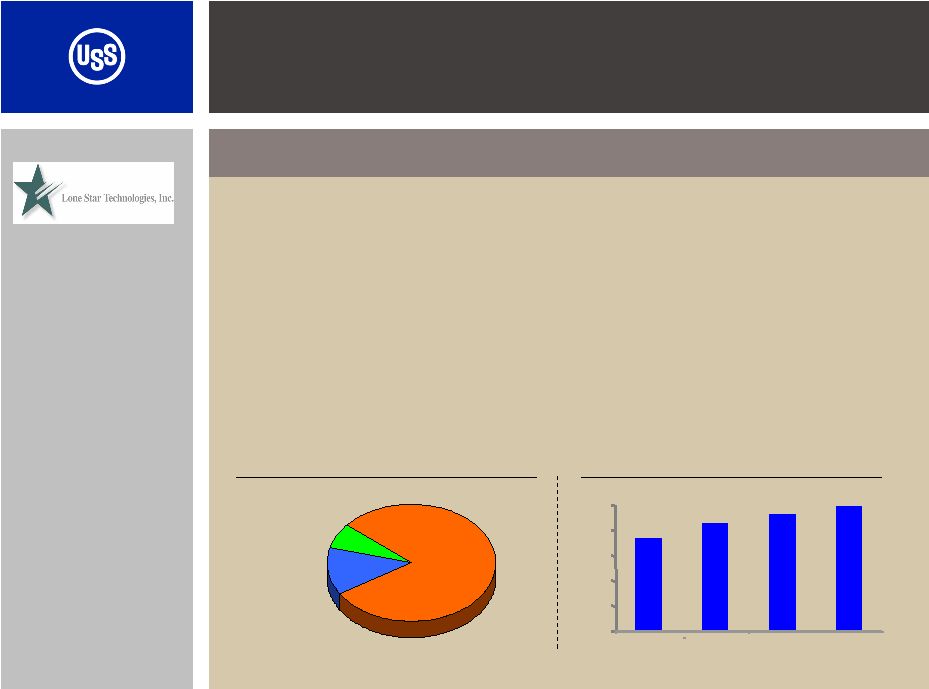 27 Leading North American producer of welded OCTG Major producer and marketer of line pipe Major supplier to oil patch of threading,heat treating and finishing Annual production capacity of 1mm tons*. 2006 revenues of $1.4 billion and EBITDA $203* million Lone Star Steel Technologies, Inc. (LSS) Business Overview Product Mix by Revenue Oilfield Products 80% Specialty 13% Other 7% 2006 Revenue = $1,378mm Shipment History (000 tons) 734 882 926 996 0 200 400 600 800 1,000 2003 2004 2005 2006 Other Businesses: Producer of specialty tubing Marketer of OCTG and Line Pipe for others Producer/supplier of hot rolled steel * EBITDA is not a GAAP measure. Please refer to the forms 10-K for the year ended
December 31, 2006 filed by U. S. Steel and Lone Star, respectively, for
GAAP financial information. |
 28 Complementary Assets & Attributes Expanded and Complementary Product Portfolio Strong Tubular Product Mix Creates largest North American fully integrated seamless and welded tubular producer Annual synergies estimated to be in excess of $100 million: Sourcing semi-finished product SG&A, Procurement and Best Practices Lone Star Steel Technologies, Inc. Business Case for Acquisition The premier North American supplier to the attractive and growing OCTG market sector |
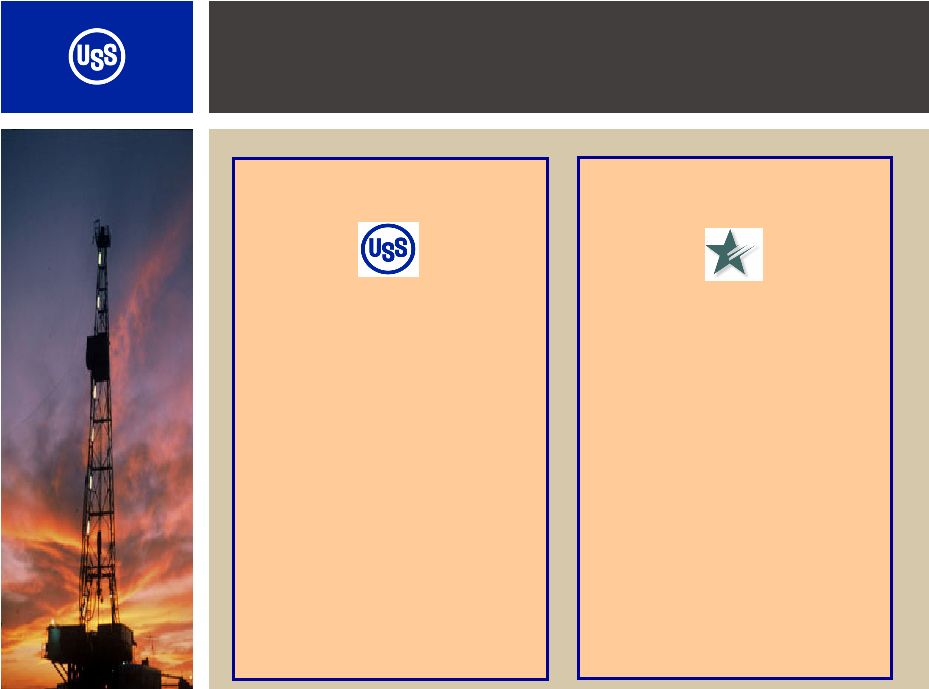 U.S. Steel and Lone Star - Complementary Assets & Attributes Significant North American seamless supplier Full seamless size range 1.9” through 26” Limited welded pipe supplier World class manufacturing facilities with heat treating capacity Strong distributor relationships Leading North American welded pipe supplier Full size welded range utilizing the Alliance mills 1” through 60” Additional heat treating Coupling supply Tubing finishing & threading Primarily direct to end customer U. S. Steel Lone Star Technologies 29 |
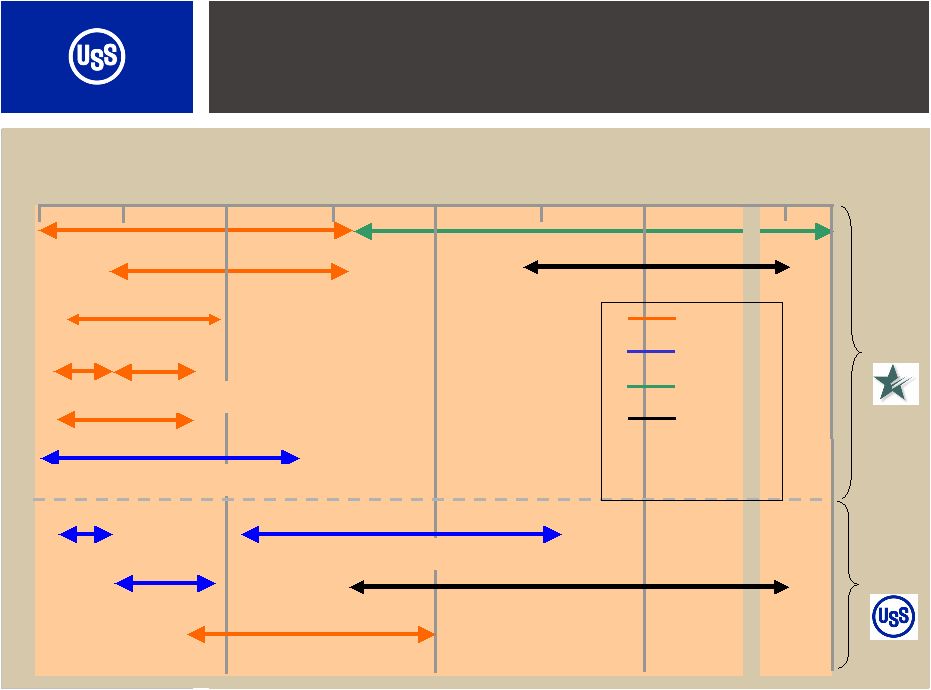 1 5 10 15 20 25 30 60 Inches Lone Star Steel Welspun * Northwest Pipe * Bellville Texas Tubular * Tex-Tube * Lorain #4 Lorain #3 Fairfield Camp Hill Hunan Valin – Potential JV Expanded and Complementary Product Portfolio USSK 50 30 Welspun JV ERW Seamless DSAW Spiral Welded * Identifies LSS alliances Apolo JV LSS USS |
 31 U. S. Steel and Lone Star - Strong Tubular Product Mix OCTG 59% 2006 Pro forma Shipments (2.2 mm tons) U. S. Steel (1.2 mm tons) S&L** 29% Lone Star (1.0 mm tons) OCTG 59% S&L** 41% OCTG 59% S&L** 15% Specialty * 9% LSS Flat Roll 17% Specialty 4% LSS Flat Roll 8% *Customer specified (custom) dimensions and grades **S&L = Standard and line pipe |
 32 0 1 2 3 USS / LSS IPSCO / NS Group Tenaris / Maverick V&M Star Creates the Largest N.A. Seamless and Welded Tubular Producer Million Tons 2.8 * 2.4 1.7 0.5 Tubular Capacity Source: Company filings and equity research ** ** * 1.8 mm USS & 1.0 mm LSS * * 2006 Acquisitions |
 Strong Market Outlook Drives Demand Spot Price WTI Spot Price Source: Spears 500 1,000 1,500 2,000 2,500 '00 '01 '02 '03 '04 '05 '06 '07 '08 '09 '10 '11 Total N.A. Rig Count $ Barrel $ mmbtu Natural Gas Price 33 0 20 40 60 80 '00 '01 '02 '03 '04 '05 '06 '07 '08 '09 '10 '11 2 4 6 8 10 |
 Financial Overview of Tubular Business Tons Shipped 34 U.S. Steel Tubular Lone Star Revenue EBITDA** % margin Operating Income % margin 1.2 million 1.0 million* $1,798 $1,378 $631 $173 $644 $203 35.1% 12.5% 35.8% 14.7% Source: Company filings * Excludes alliance mills & Apolo joint venture ** EBITDA is not a GAAP measure. Please refer to the forms 10-K for the year ended
December 31, 2006 filed by U. S. Steel and Lone Star, respectively, for
GAAP financial information. FY 2006 $ millions |
 U.
S. Steel and Lone Star Technologies Creates the leading North American
supplier of OCTG products • Largest North American supplier of seamless and welded pipe to energy sector • Leverages U.S. Steel’s production platform to drive operating performance Financially attractive: • Potential annual synergies in excess of $100 million by 2008 • Accretive before synergies • Maintains financial flexibility
post-transaction 35 Transaction Summary |
 Additional Information 36 In connection with the proposed merger, Lone Star Technologies, Inc. intends to file a proxy statement and related materials with the Securities and Exchange Commission (SEC). The documents will contain important information about the proposed merger, and the shareholders of Lone Star are urged to read the carefully when they become available. These documents, when filed with the SEC, will be available for free at the SEC’s website, http://www.sec.gov and at Lone Star’s website, http://www.lonestartech.com. |
 Strategic Acquisition of Lone Star Technologies, Inc. © United States Steel Corporation 2007 |